Sales and Profits Visualization
Project information
Roles:
- Data Analyst
Key Skills:
- Data Cleaning
- Data Analysis
- Data Visualization
Summary
A dashboard showing the sales, profits and discounts of products in different regions. In this personal project, I created a dashboard that shows the sales of different product categories and profits obtained. In this dashboard, viewers will also be able to see the discounts given per each product category.
Visualization
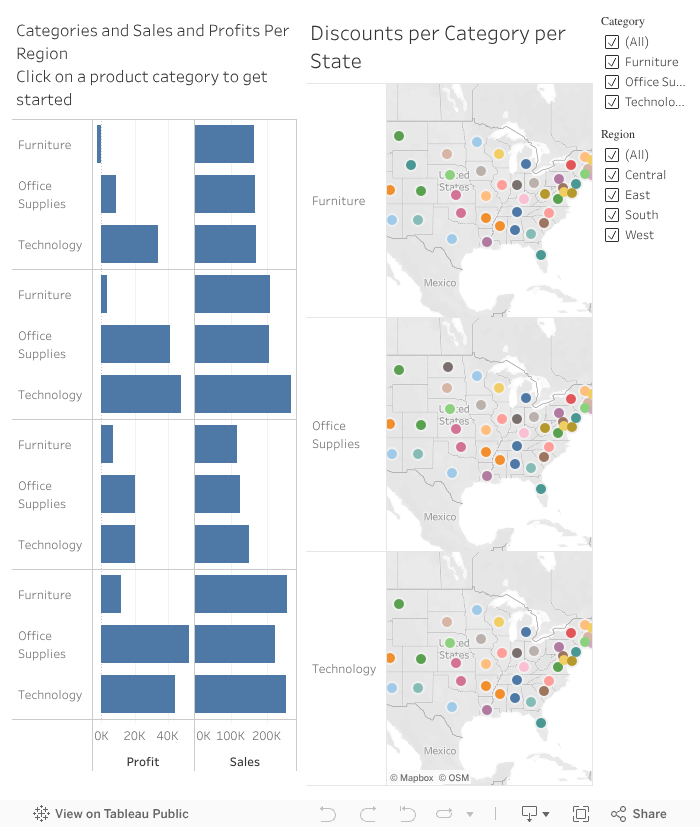
From the dashboard, we can see that:
- The business made losses from the sale of Furniture in Central Region.
- The business made more profit from the sales of Technology.
- Sale of Furniture is not a very profitable business.
Takeaways and Learnings
- How to clean and prepare data
- Data visualization techniques